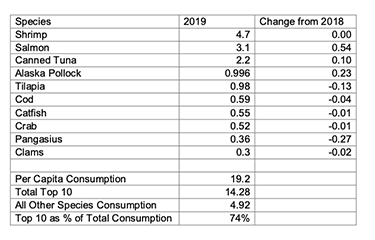
NFI releases new list detailing the top 10 seafood species Americans consume most

American consumers ate 19.2 pounds of seafood per capita in 2019, an increase of 0.2 pounds over 2018’s figures, according to National Fisheries Institute (NFI) calculations based off of the National Oceanic and Atmospheric Administration’s (NOAA) latest “Fisheries of the United States” report.
For its report released this year, which recounts 2019 figures, NOAA revised its per capita consumption model, “updating weight conversion factors to more accurately reflect efficiencies in processing,” NFI said.
“In previous years, the top 10 list has made up an outsized portion of U.S. seafood consumption, nearly 90 percent. This time the familiar names on the top 10 make up only 74 percent,” NFI said in a press release.
Nevertheless, shrimp maintained the top spot – as it has in previous iterations of NFI’s list – with U.S. consumers eating 4.7 pounds per capita of the species. Salmon (3.1 pounds), canned tuna (2.2 pounds), and Alaska pollock (0.996) all saw increases over 2018 figures, when Americans consumed 19 pounds of seafood per capita. Rounding out the rest of the list were tilapia, cod, catfish, crab, pangasius, and clams.
“It is important to highlight that the featured numbers on this list are all exclusively from 2019 and do not represent any pandemic-impacted market forces,” NFI said.
The organization, which is the largest U.S. seafood trade group, added that the 2019 figures suggest that U.S. consumers are diversifying seafood consumption, with “Americans eating more and different seafood.” While the top 10 seafood species accounted for 14.28 pounds of the category consumed per capita in 2019, 4.92 pounds came from other species, NFI tallied.
NOAA had used its previous model dating back to 1990, and set out to examine if the calculations used for consumption metrics should be updated based on new data sources and processes within the industry.
“In 2019, the NMFS Office of Science and Technology undertook a thorough examination of the calculation used to estimate per capita consumption. The goal of this review was to update the calculation based on newer available sources of data and make any needed corrections and updates. An initial review suggested that the treatment of Alaska pollock and products processed from Alaska pollock should be the focus, based on the very large contribution of Alaska pollock to U.S. domestic landings,” NOAA stated in it report.
The agency also discovered that “processing efficiency of pollock has greatly increased since the 1990s, suggesting that the related factors used to convert from processed Alaska pollock products to Alaska pollock catch should be examined,” it said.
Over the past three decades, consumption figures for the U.S. teetered mostly between 15 to 16 pounds per capita based on NOAA’s old model. With the agency’s new calculations, U.S. consumption per capita from 2010 to 2014 has hovered in the range of 17 pounds, dipping to 16.8 pounds in 2012. In 2015 and 2016, Americans consumed 18.8 pounds and 18.3 pounds of seafood per capita, respectively. In 2017, consumption figures rose to 19.1 pounds per capita before dropping to 19.0 pounds in 2018 under the new model.
Photo courtesy of the National Fisheries Institute


Share